New Report: The Fall Gala Season Opens This Month. The Biggest Fundraiser in America Is Still a Bike Ride.
The Benefit Event Census, a new report from GatheringArchitecture.com ranks 120 American benefit events by what they actually raise. Link to our in depth analysis at Gatheringarchitecture.com
A note from the editor. The gathering economy is everything that happens when people come together on purpose, for a defined event, in a defined place, for a defined time: the organizers who own those gatherings, the venues that hold them, the suppliers who make them possible, and the platforms that connect them all. It is everywhere, and almost nobody keeps its books. Law has its case digests and medicine its journals, but this industry has never had a reference layer under its news, so I am building one. The fundrasising world uses events and have the same passion as people in corporate events, trade shows, marketing, ceremonial and other aspects of gatherings. GatheringPoint reports on the gathering economy. Gathering Architecture documents how it works, with more than 30 working tools, a crisis simulator with 34 scenarios, the working methods of more than 70 practitioners and a glossary of nearly 90 terms. Its Papers add the evidence, and the census below is Paper No. 02. Every figure carries its source or is left blank, corrections are dated on the page, and it will be rebuilt every year. Like everything on the site, it is free and ungated. David Adler
It takes more than 1,500 staff, vendors and production crew, working around the clock for roughly 170 hours, to turn 400,000 square feet of the Jacob K. Javits Center into a single room. That room is where the Robin Hood Foundation, the New York anti-poverty charity, holds its annual benefit. The crew builds it for one night, then takes it apart.
In May that room raised $73 million, the largest total in Robin Hood’s history. The same evening launched a $1 billion endowment campaign anchored by the Bezos family. Richard R. Buery, Jr. has run Robin Hood as chief executive since 2021.
Nine months earlier, 6,500 people rode bicycles across Massachusetts over a weekend. No room, no build, no seating chart. The Pan-Mass Challenge delivered $78 million to the Boston cancer center Dana-Farber, which makes it the largest benefit event in the United States: the largest single gathering held to raise money for a charity. Billy Starr founded it in 1980, still chairs it, and still rides.
Nobody in the gathering economy could have looked that up, because nobody keeps the list. Today Gathering Architecture publishes it. The Benefit Event Census counts 120 benefit events across 21 markets, ranked by verified dollars. Every confirmed figure links to its source, and every unconfirmed one is left visibly blank. Each total is the most recent edition on record, which for 29 of the 34 means 2025 or 2026. The Pan-Mass figure is the 2025 ride, since the 2026 total has not been announced. Robin Hood’s is from this May. It arrives in the week the fall season opens, when development directors, the people who run a charity’s fundraising, are building committees and pricing tables. It found five things, and the first is the one you have just read.
The biggest benefit events are not galas
The pattern holds well past the top two. The Met Gala raised a record $42 million. Tipping Point Community, a San Francisco anti-poverty charity, raised $40,287,321 at its May benefit, though $25 million of that came from a single gift by Sue and John Sobrato. Fifth is the Naples Winter Wine Festival at more than $30 million, chaired by Rob Heidt Jr. of the Naples Children Foundation. Sixth is Old Bill’s Fun Run in Jackson Hole, run by Laurie Andrews at the Community Foundation of Jackson Hole. Three of the eight largest benefit events in America are a ride or a run.
Old Bill’s deserves a second look. It raised $26,104,015 from 4,246 donors in a county of fewer than 25,000 people. The Chronicle of Philanthropy profiled it in June as a structure that shifts power to everyday donors. The census puts a number on how far that structure can go.
Seats cap the money
The reason is structural, and a theater explains it. A theater holds a fixed number of seats, so the only way to earn more is to charge more for each one. A gala works the same way. Its money is capped by the number of seats times the price of a table, which is why the census calls it a seated benefit. A ride or a run has no house. The ticket is cheap or free, and the money grows with every person who signs up, which is why the census calls it a participatory event.
The numbers follow the theater. Six participatory events in the census produce $125.0 million. Twenty-three seated benefits produce $233.2 million. Per event, that is $20.8 million for the participatory events against $10.1 million for the seated ones, roughly two to one.
None of this means the gala is finished. The fundraising platform OneCause reports that 97 percent of nonprofits held an event in 2025 and that 77 percent met or exceeded their event fundraising goals, with the organizations that held in-person events only doing better still, at 80 percent. Those goals are set by the organizations themselves, so the number measures confidence as much as performance. The pressure is not on the format. It is on the people running it.
A development team of three that produced a gala in 2015 is now a team of two producing the same gala, alongside grants, monthly giving and donor care. In a crowded market, the same loyal supporter is being asked to buy five tables instead of one.
SIDEBAR | What a room like that costs to build
The Robin Hood benefit is not a dinner with a stage at one end. It is a temporary building. More than 1,500 staff, vendors and production crew work around the clock for roughly 170 hours to convert over 400,000 square feet of the Javits Center, and it comes down the same week. This year the decor was also inventory: the cocktail installations and dinner centerpieces were built from nearly 60,000 donated shelf-stable food items and pieces of kitchenware, given afterward to City Harvest, River Fund, Grand Street Settlement and other Robin Hood community partners. Robin Hood credits 50 partners by name for the 2026 benefit, which almost no other organization in this census does. The full production credit, with links, is published at All-Star Event Partners.
Resort markets are not smaller versions of city markets. Naples raised more than $30 million in a single January live auction, across 51 lots, in a county of roughly 400,000 people. Palm Beach does not compete on any one night. It competes on the calendar, running more than 60 galas between December and April.
Technology money bought the top of the market
The buyers at the top changed in a single year. The Met Gala went from $31 million to $42 million. Individual tickets rose to $100,000 from roughly $75,000, and the $350,000 tables were bought by Amazon, Meta, OpenAI and Snapchat. Jeff Bezos and Lauren Sanchez Bezos led the sponsors at a reported $10 million, the first year a technology figure held that role rather than a fashion house. Anna Wintour has chaired the gala since 1995. Max Hollein runs the museum that banks the proceeds.
Fashion money built that event. Technology money owns it now, and it brings a reputational risk the old buyers never carried. In San Francisco the shift reached the cause itself. Sam Cobbs, Tipping Point’s chief executive, used the May benefit to launch a push to prepare Bay Area workers for an economy reshaped by artificial intelligence.
Most of the industry does not publish a number
Of the 120 events in the census, only 34 publish a total anyone can verify. Five entire markets, including Nashville, Atlanta, Philadelphia and Louisville, produced no confirmed figure at all. Nashville’s Swan Ball has anchored its market for decades and does not publish a total. There is no shared scoreboard in benefit fundraising. That is why the census had to be built by hand, and why the paper prints the blanks instead of filling them with estimates.
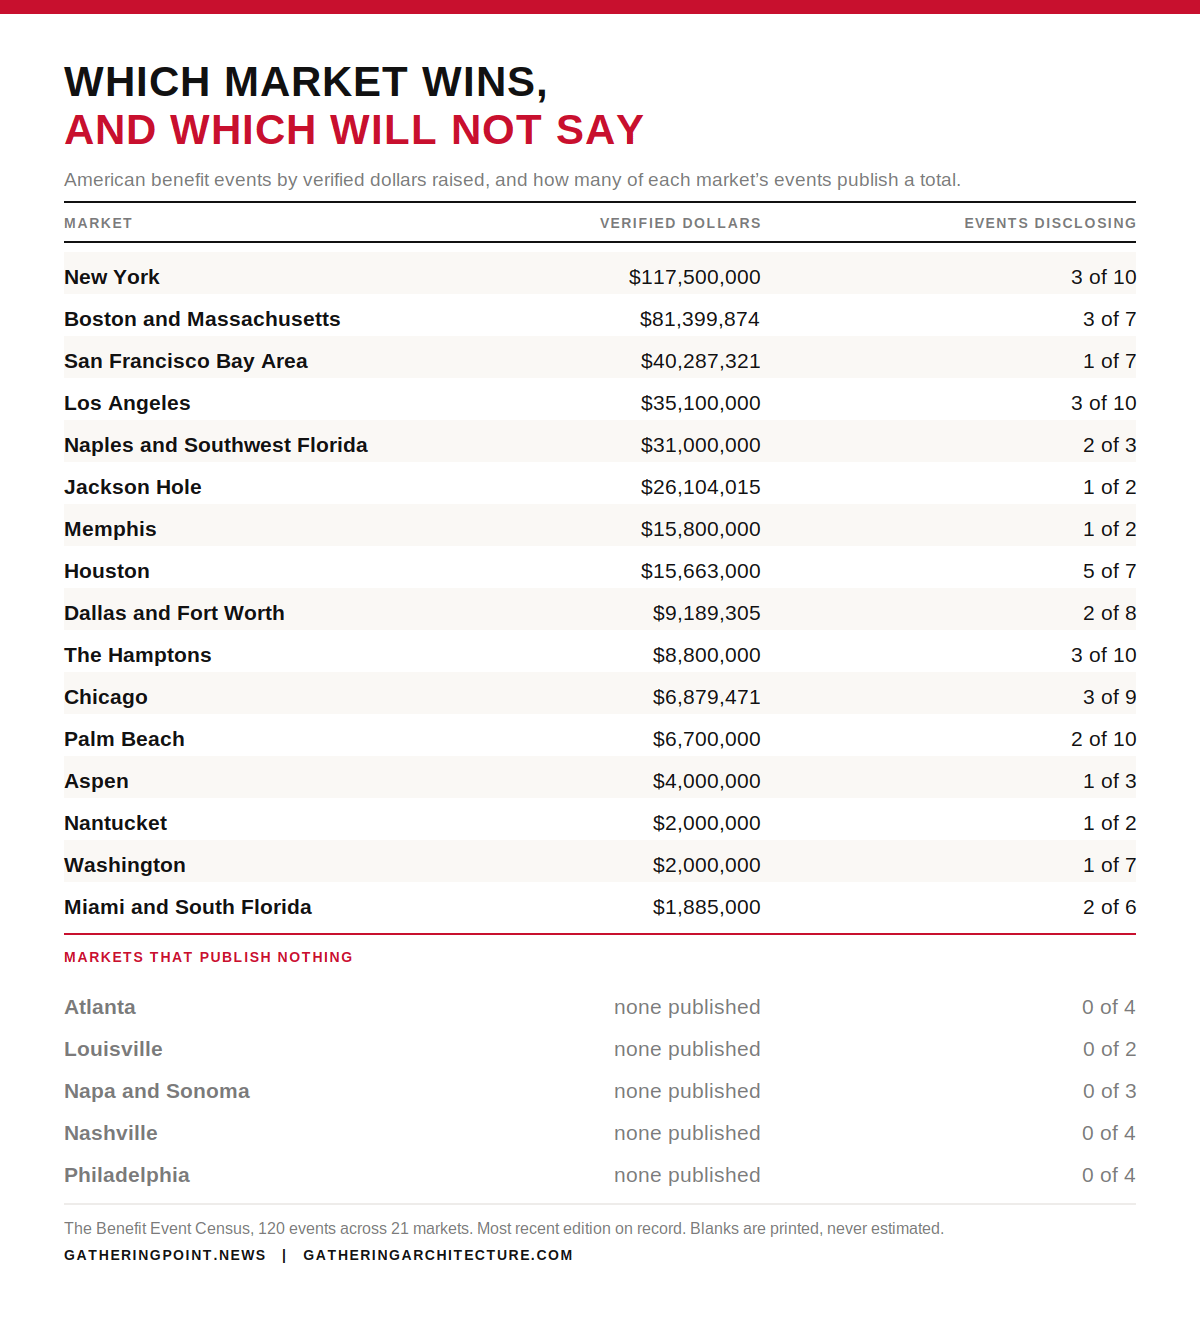
SIDEBAR | Which market wins, and which will not say
This is a disclosure map more than a fundraising map, and the right-hand column is the one to read. New York leads on money, but only three of its ten listed events publish a number. Houston discloses five of seven and still lands eighth, which suggests a market that is underrated rather than outperformed. San Francisco’s entire total is one event. And five markets produced no verified figure at all, which is not a measure of their generosity, only of their silence.
Market Verified dollars Events disclosing New York $117,500,000 3 of 10 Boston and Massachusetts $81,399,874 3 of 7 San Francisco Bay Area $40,287,321 1 of 7 Los Angeles $35,100,000 3 of 10 Naples and Southwest Florida $31,000,000 2 of 3 Jackson Hole $26,104,015 1 of 2 Memphis $15,800,000 1 of 2 Houston $15,663,000 5 of 7 Dallas and Fort Worth $9,189,305 2 of 8 The Hamptons $8,800,000 3 of 10 Chicago $6,879,471 3 of 9 Palm Beach $6,700,000 2 of 10 Aspen $4,000,000 1 of 3 Nantucket $2,000,000 1 of 2 Washington $2,000,000 1 of 7 Miami and South Florida $1,885,000 2 of 6 Atlanta none published 0 of 4 Louisville none published 0 of 2 Napa and Sonoma none published 0 of 3 Nashville none published 0 of 4 Philadelphia none published 0 of 4
Verified dollars are the sum of confirmed totals for each market’s listed events, most recent edition on record. Blanks are printed rather than estimated.
Robin Hood’s room at the Javits takes 170 hours to build. The Pan-Mass Challenge needs only a road. The census exists so that anyone can see which one raised more, and start asking why.
Somebody has to keep the books of the gathering economy. If you work on the production or development side of any event in the census and hold a number the press never got, send it. The second edition lands after Old Bill’s reports its thirtieth-anniversary total on October 28, and Nashville, Atlanta, Philadelphia and Napa are the markets where we currently have nothing.